Data Visualisation with Tableau
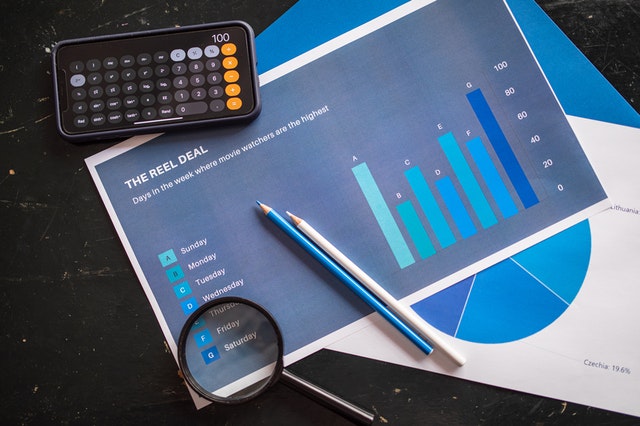
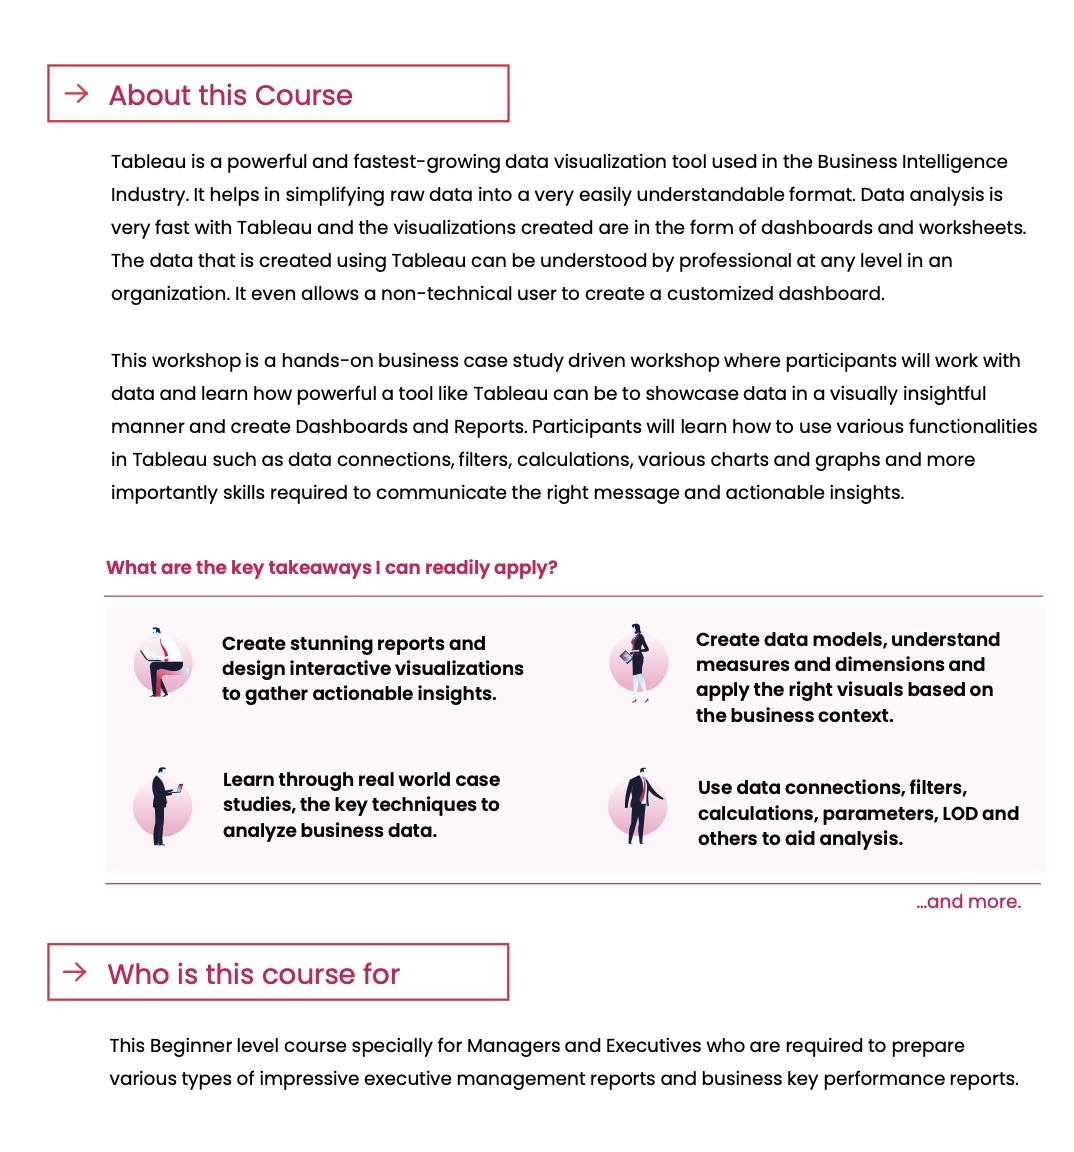
Tableau is a powerful and fastest-growing data visualization tool used in the Business Intelligence Industry. It helps in simplifying raw data into a very easily understandable format.
This workshop is a hands-on business case study-driven workshop where participants will work with data and learn how powerful a tool like Tableau can be to showcase data in a visually insightful manner and create Dashboards and Reports.
Our Team
Get to know us
Our experienced team delivers amazing results
We have a can-do attitude backed up by more than 20 years experience delivering high-end, creative solutions on time and on budget.

Name Surname
Position

Name Surname
Position

Name Surname
Position

Name Surname
Position

Name Surname
Position

Name Surname
Position
Data Visualisation with Tableau SkillsFuture WSQ.


Workshop Outcome
What will I learn?
This Beginner level course especially for Managers and Executives who are required to prepare various types of impressive executive management reports and business key performance reports. This course is suitable for beginners and does not require any prior knowledge of the tool.
- Data Collection, Ingestion, and Preparation
- Data Normalization and Tables
- Understanding Data Storytelling
- Tableau Overview
- Data Sources, Worksheet and View
- Charts, Graphs, and Formatting
- Organize & Transform Data, Calculations and Functions
- Advanced Analytics
- Maps (Internal and External)
- Creating Analytical Dashboards
- Statistics Behind Good Storytelling
- Case Study Analysis
At the end of this workshop, participants will learn how to use various functionalities in Tableau such as data connections, filters, calculations, various charts and graphs, and more importantly skills required to communicate the right message and actionable insights.
Course Information
Course Fee
Full Fee: $820.00
* Course Fee shown here represents the nett fee (excl. GST)
Course Information
Building Dynamic Dashboards for Business Intelligence
Reference No : TGS-2017500064
Course Duration: 14.00 hours (In-Class)
Funding Validity : 27 Jan 2021 – 26 Jan 2023

